Hey everyone, dropping a fairly big update. Quite a lot has changed. ![]()
3D Point Cloud Studio
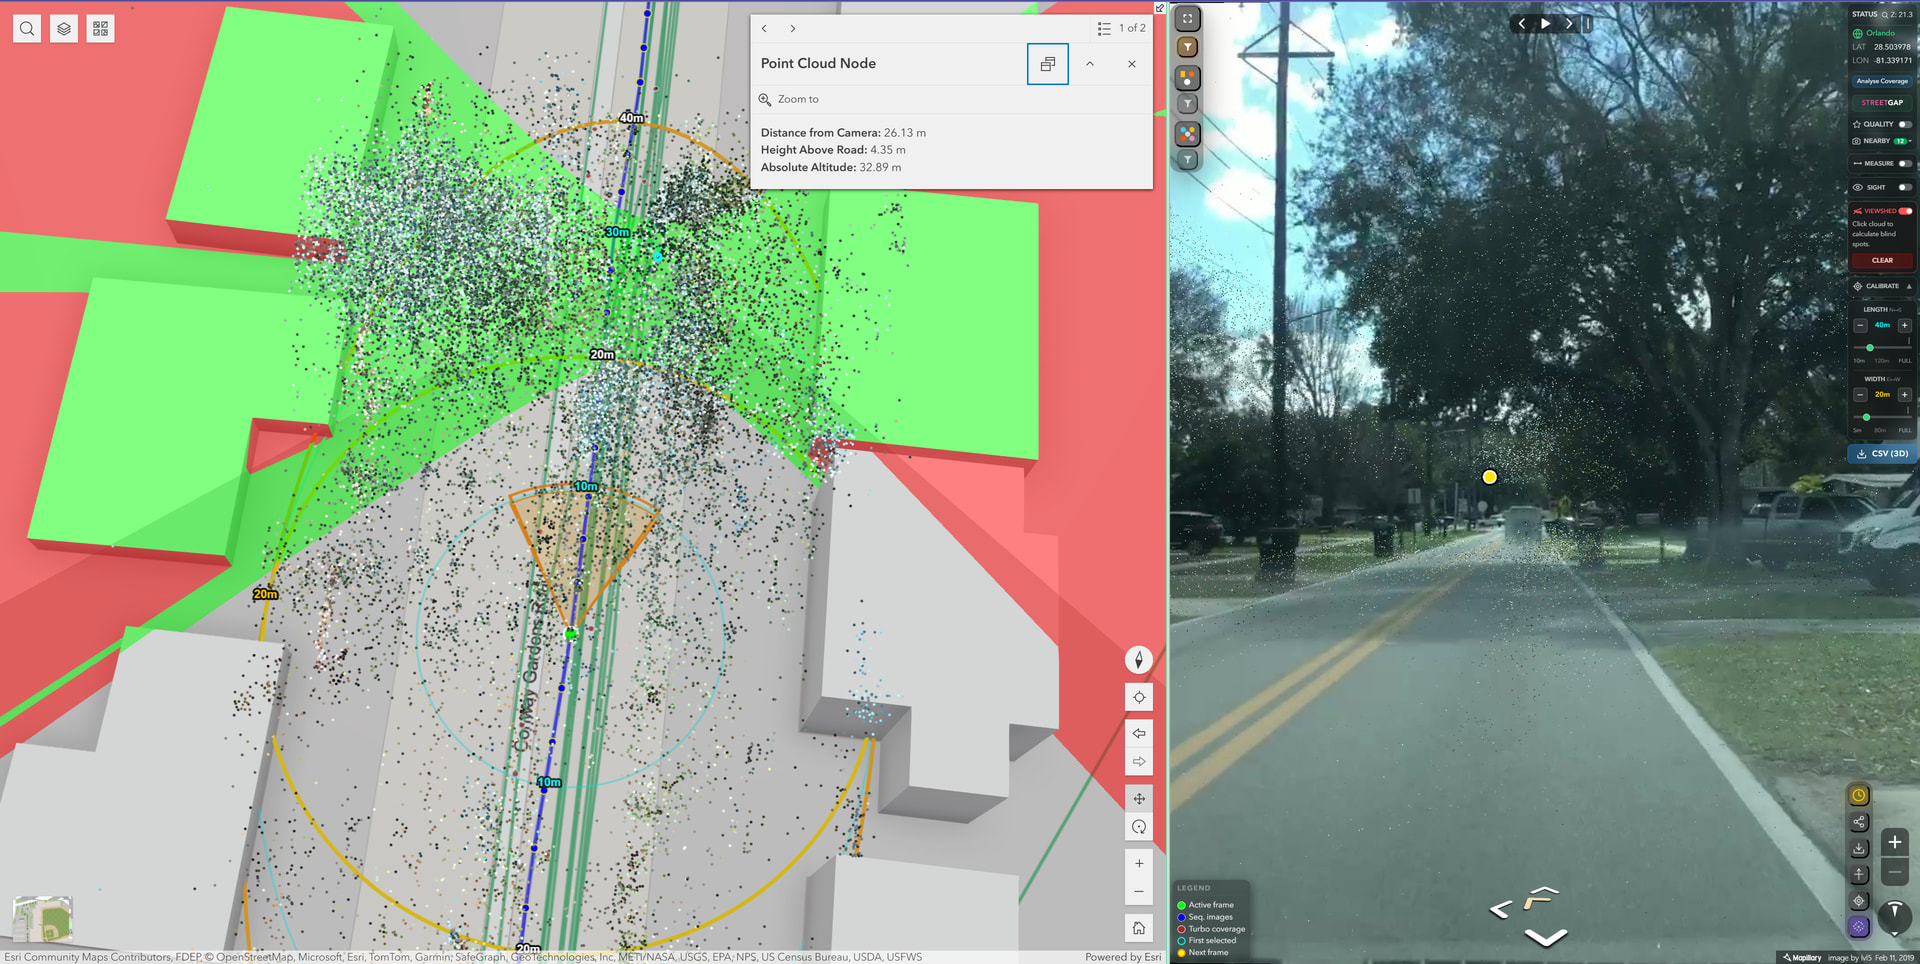
The biggest addition in this release. You can now load Mapillary SfM point clouds directly into your ArcGIS 3D scene and work with them as fully georeferenced data. The cloud renders simultaneously in the scene and projected into the panoramic viewer, with per-point RGB color from the SfM cluster data.
A few things that make it actually useful for fieldwork:
- Elevation Heatmap (C key) recolors the cloud from below-ground blue up to rooftop red, useful for quickly understanding vertical structure
- Ground Mode (X key) hides everything above 1.5m instantly, good for pavement inspection without buildings and vegetation in the way
- Nudge tool lets you shift the cloud in real-world metres relative to your camera heading for GIS alignment. Keyboard (WASD) or the on-screen joystick for touch and trackpad users
- Radius slider limits how many points render around your position. This was added specifically to deal with the lag that happens when a full SfM cluster (sometimes 200k+ points) loads into a 3D scene. Drag it down to 10-15m when inspecting a specific sign or wall, open it back up for export
- Auto-advance - when you navigate into a new SfM cluster boundary, it silently downloads the next block, no interaction needed
- CSV export with Longitude, Latitude, Elevation, R, G, B - calibration offsets baked in, ready for AutoCAD Civil 3D or ArcGIS Pro

Sight Mode, Viewshed & Measurement
Four new analytical tools available when a point cloud is loaded:
- Line of Sight - place an observer with a click, add targets, green = visible, red = obstructed. Backed by ArcGIS LineOfSightViewModel
- 360° Viewshed - computes full-sphere sight coverage from the current camera position using the SfM geometry as the obstruction mesh, so results are grounded in the actual scene rather than a DTM
- 3D Measurement - click any two point cloud nodes to draw an anchored line between them. The widget computes true 3D distance, including horizontal and vertical components, and renders the result as floating text in the ArcGIS scene. The same line is projected simultaneously into the Mapillary panorama, so you can see exactly where both endpoints sit in the real-world image
- Point hover inspection - hover any point in the cloud to see where that exact point appears in the live Mapillary panoramic capture. Useful for confirming what a point actually represents before measuring or exporting

All four modes clean up after themselves properly between sessions.

New Mapillary API Capabilities
Mapillary JS has been rolling out new API capabilities ![]() , and I wanted users of this widget to be able to test and benefit from them as quickly as possible.
, and I wanted users of this widget to be able to test and benefit from them as quickly as possible.
Here: https://forum.mapillary.com/t/new-radius-api-to-find-the-best-images-near-a-lat-long/10424/8Two
and here: Feedback wanted — new quality_score field on Mapillary images and sequences
Additions in this update are direct reflections of that goal.
Nearby Captures - there is now a live counter in the lower-right corner of the viewer showing how many images were captured near your current position. Click it, and a carousel opens with thumbnail previews; tap any thumbnail to jump straight to that image. This is built on a newer Mapillary API endpoint for fetching nearby images in real time, and I wanted to get it in front of users as soon as it was stable enough to ship. Handy when you are at an intersection and want to quickly check angles from nearby frames without going back to the map. Additionally, when you hover over nearby images, you’ll be able to see a yellow marker on the map indicating which location they belong to. This should at least help with identifying the direction as well, since there was also a request about this on the forum.

Image Quality Scoring - coverage sequences are now color-coded by Mapillary’s per-image quality score. As soon as this became available through the API it made sense to surface it visually so users can make informed decisions about which sequences to trust for measurement or analysis work. At a glance, you can tell which sequences are survey-grade and which are lower quality, which helps when picking source imagery for point cloud loading or export.

StreetGap Integration
The coverage analysis InfoBox now includes a shortcut to StreetGap (Ryan Lopez’s community gap analysis tool; credits and more information are available by hovering over the title). This makes it easier to check known unmapped corridors while planning routes. Personally, I really like StreetGap and have tested many, so having quick access to it directly from the toolbar felt like a worthwhile addition for the coverage analysis features.
An image quality shortcut has also been added next to it. Both shortcuts can be hidden independently, along with the coverage panel itself, for a cleaner fieldwork experience.

Turbo Mode Improvements
Turbo got a significant rework under the hood:
- Persistent spatial tile cache across the session - only tiles you have not seen yet are fetched on each pan, instead of re-downloading the entire viewport every time you stop
- Empty tiles (404) are cached and never re-requested; server errors retry on the next pan
- New features are appended to the existing layer in chunks rather than destroying and rebuilding it on every pan, which preserves the ArcGIS spatial index and removes the WebGL re-upload cost
- An ~11m spatial grid prevents duplicate points where sequence tiles overlap at lower zoom levels, keeping memory stable
Traffic Signs and Objects
Tile fetching is now fully parallel, and the sprite sheet is cached in memory across the session instead of being fetched multiple times per pan. It should feel noticeably snappier when scrolling through dense detection areas.
Bug Fixes
- The green pulsing location marker no longer disappears when the camera rotates past certain bearings in a 3D scene. This was an ArcGIS depth buffer culling issue behind the camera cone walls
- The sequence picker now clearly highlights whichever sequence is currently loaded, so you can identify it without cross-referencing the map
The source is on GitHub, and you can see and experience all the new things in the ArcGIS Online Mapillary Demo Link. Let me know if you run into anything or have questions about the point cloud tools specifically. There is a lot of new ground covered in this release. A detailed YouTube video explaining the developments and how to use it will be coming very soon. Stay tuned. ![]()